
How Chinese Automakers Are Reshaping the Global Auto Industry:A Strategic Explainer
What Is China's Auto Export Phenomenon?
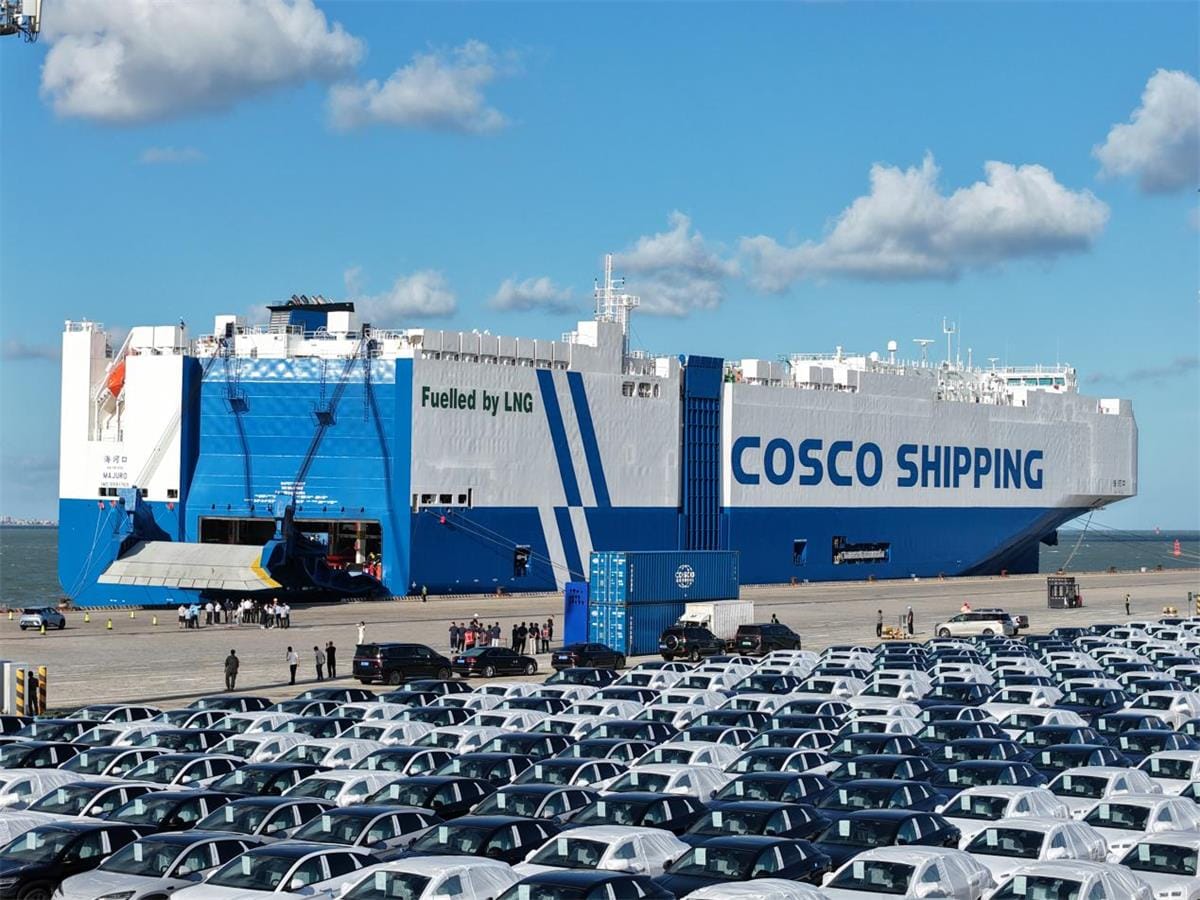
China's automotive industry has undergone a fundamental transformation from domestic manufacturer to global competitor. Between 2021 and 2025, Chinese passenger vehicle exports surged from 1.6 million units to 6.0 million units—a nearly fourfold increase. By April 2026, exports continued accelerating at 69% year-over-year growth, signaling sustained momentum rather than a temporary spike.
This isn't simply about volume. Chinese automakers now control distinct advantages in electric vehicle (EV) technology, manufacturing scale, and increasingly, local production capabilities across multiple continents. The shift represents a structural change in global automotive supply chains, not a cyclical trade pattern.
Why Chinese Auto Exports Matter Now
The New Energy Vehicle Advantage
Chinese manufacturers have achieved technological and cost leadership in EVs and plug-in hybrids—the fastest-growing automotive segment globally. In 2025, new energy vehicles (NEVs) comprised 37% of Chinese exports, up from 22% just one year earlier. This timing aligns with accelerating global electrification policies and infrastructure development.
Traditional automotive powerhouses lag considerably. Volkswagen Group's NEV penetration reached only 15.3% in 2025, while Toyota and General Motors managed just 3.2% and 6.0% respectively. Chinese brands benefit from a massive domestic market where NEV penetration exceeds 50%, providing scale advantages that compress costs and accelerate iteration cycles.
Geopolitical Energy Dynamics
Historical patterns suggest energy crises catalyze automotive market disruptions. Japanese automakers captured U.S. market share following 1970s-1990s oil shocks, rising from 4-5% (1971-1974) to nearly 20% by 2000. Each oil price spike corresponded with market share gains for fuel-efficient Japanese vehicles.
The 2025-2026 U.S.-Iran conflict has pushed Brent crude above $90/barrel, similar price levels to previous disruption periods. Higher fuel costs amplify the economic advantages of electric vehicles, potentially accelerating adoption curves beyond policy-driven growth alone. Chinese automakers, as NEV technology leaders, are positioned to benefit from this dual catalyst: policy support plus economic necessity.
How the Global Market Structure Is Changing
Regional Market Dynamics
Accessible International Markets: Excluding North America, Japan-Korea, and India (where market barriers remain high), Chinese automakers can actively compete in markets representing approximately 29.5 million annual vehicle sales as of 2025:
- Europe (EU + UK + EFTA + Russia): 13.3 million units, 29.1% NEV penetration
- Southeast Asia: 3.4 million units, 14.7% NEV penetration
- Latin America: 5.7 million units, 2.8% NEV penetration
- Middle East/Central Asia: 3.6 million units, 6.7% NEV penetration
- Africa: 770,000 units, 0.6% NEV penetration
- Oceania: 1.4 million units, 8.9% NEV penetration
Combined NEV penetration across these regions averaged just 16.6% in 2025—far below China's 50%+, indicating substantial growth potential.
Competitive Positioning
In 2025, Chinese brands held only 10.7% share across accessible international markets, compared to Japanese brands' 23.1%. This gap represents potential doubling of Chinese market presence—even without displacing European or American competitors.
Chinese automakers dominate new energy segments within these markets:
- Southeast Asia: 51.0% of NEV sales (led by BYD at 28.2%)
- Latin America: 85.8% of NEV sales (BYD: 73.4%)
- Middle East/Central Asia: 35.0% of NEV sales (BYD leads at 23.4%)
- Oceania: 55.6% of NEV sales (BYD: 42.6%)
Only in Europe do Chinese brands face more balanced competition, holding 12.3% of the NEV market in 2025—though this represents rapid growth from near-zero five years earlier.
Key Structural Factors Driving Long-Term Growth
Policy Architecture
Governments across accessible markets have implemented comprehensive NEV support frameworks:
Europe: Germany reinstated purchase subsidies up to €6,000 (2026), France offers €3,500-5,700 based on income, Spain provides up to €4,500 for EU-produced EVs. Tax advantages include reduced circulation taxes, accelerated depreciation for corporate fleets, and VAT exemptions.
Southeast Asia: Thailand's "30@30" strategy targets 30% zero-emission vehicle production by 2030 with purchase subsidies of 50,000-100,000 baht. Indonesia provides 40-100% VAT reductions on qualifying EVs while excluding hybrids. Malaysia offers subsidies up to 10,000 ringgit.
Latin America: Mexico provides up to 86% tax credits on EVs and hybrids. Brazil reduced industrial product tax (IPI) for sustainably-produced vehicles. Argentina dropped import tariffs to zero for EVs valued under $16,000 (50,000-unit annual quota).
Middle East: UAE offers 0% tax rates plus VAT refunds on EVs/hybrids. Saudi Arabia's "Vision 2030" includes 15% purchase subsidies (up to 100,000 riyals) plus registration fee waivers for locally-produced EVs.
These policy structures favor Chinese manufacturers who lead in NEV technology and can price competitively even with subsidy phase-downs.
Manufacturing Scale Economics
Automotive production exhibits strong scale economies. Chinese automakers achieve unit economics traditional manufacturers cannot match at lower volumes. BYD sold 1.05 million vehicles internationally in 2025, while leading Chinese exporters (Chery, BYD, Geely, Great Wall, Changan) collectively targeted 5.2 million overseas units for 2026—a 31% increase over 2025's 3.96 million.
This scale advantage compounds through faster R&D amortization, supplier negotiations leverage, and learning curve effects. European and American manufacturers struggle to match Chinese NEV pricing while maintaining profitability at their current production volumes.
Localization Strategy Evolution
Chinese automakers are transitioning from export models to local production:
Europe: 61 manufacturing facilities across 18 countries, including 36 with complete vehicle assembly capability and 24 producing electric vehicles. Sweden hosts 10 facilities, Russia 9, UK 7.
Other Regions: 107 facilities across 22 countries, with Malaysia (17), Brazil (12), and Pakistan (11) leading. These 107 plants include 95 capable of complete vehicle assembly and 55 producing EVs.
Local production mitigates tariff exposure, reduces logistics costs and lead times, and demonstrates long-term market commitment that builds brand credibility. The Stellantis-Leapmotor joint venture exemplifies this approach: Leapmotor International operates approximately 900 sales and service locations globally (800+ in Europe) using Stellantis's existing dealer networks.
Critical Constraints and Variables
Market Access Barriers
Tariff structures: The EU imposed anti-subsidy duties on Chinese EVs in 2024-2025, though rates vary by manufacturer (Tesla: 9%, BYD: 17%, SAIC: 36.3%). Local production mitigates but doesn't eliminate these costs.
Regulatory compliance: European Type Approval requirements, U.S. FMVSS standards, and market-specific safety/emissions regulations demand significant engineering adaptation. Chinese automakers have improved compliance capabilities but face ongoing costs.
Brand perception: Chinese automotive brands lack heritage in premium segments. While NEV technology provides differentiation, building brand equity to support premium pricing remains challenging. Most Chinese exports compete in volume segments where margins are thinner.
Infrastructure Dependencies
EV adoption requires charging infrastructure that varies dramatically by region:
- Europe: Mature networks in Western Europe; Eastern Europe/Russia lag significantly
- Southeast Asia: Rapid development in Thailand/Indonesia; nascent elsewhere
- Latin America: Limited infrastructure outside major urban centers
- Africa: Severely underdeveloped; restricts NEV viability to urban South Africa/North Africa
Infrastructure gaps create adoption ceilings independent of vehicle pricing or subsidies. Chinese manufacturers' hybrid offerings (PHEVs, range-extenders) address this constraint but reduce their technological differentiation.
Competitive Response
Incumbent automakers are not static. Volkswagen announced €180 billion in electrification investments through 2028. Stellantis partners with multiple Chinese manufacturers (Leapmotor, potentially others) to access technology while defending market position. Tesla maintains cost leadership in certain segments.
The critical question: Can incumbents achieve competitive NEV economics before Chinese brands establish unassailable market positions? Current data suggests incumbents face structural disadvantages (legacy cost structures, dealer network conflicts, slower decision cycles), but outcomes remain uncertain.
What Happens Next: Scenario Analysis
Baseline Scenario: Continued Share Gains
Chinese automakers reach 15-18% share in accessible international markets by 2028-2030, driven by:
- NEV penetration increasing to 30-35% in Europe, 25-30% in Southeast Asia, 8-12% in Latin America
- Chinese brands capturing 40-50% of NEV sales in most regions (except Europe: 20-25%)
- Local production reducing tariff exposure and improving unit economics
- Gradual brand perception improvements through product quality and ownership experience
This scenario implies Chinese overseas sales reaching 8-10 million units annually by 2030.
Accelerated Scenario: Market Leadership
If energy prices remain elevated and policy support intensifies, Chinese brands could reach 20-25% international market share by 2030:
- Global NEV penetration accelerates to 40%+ in developed markets, 20%+ in emerging markets
- Chinese brands dominate NEV segments with 60%+ share outside Europe
- Premium brand development succeeds (Zeekr, Avatr, others), enabling margin expansion
- Technology leadership extends to autonomous driving and vehicle software
This scenario would represent 12-15 million annual overseas sales—approaching Japanese automakers' current global footprint.
Constraint Scenario: Stalled Progress
Protectionist measures intensify, infrastructure development disappoints, or incumbent manufacturers successfully close the technology gap:
- Tariff structures and non-tariff barriers limit Chinese share to 12-15% by 2030
- Local production requirements strain capital and operational capabilities
- Brand perception challenges persist in profitable segments
- Price competition erodes margins, limiting investment in next-generation technologies
Even this scenario represents doubling Chinese international presence from 2025 levels, but with compressed profitability.
Investment and Strategic Implications
For Automakers
Chinese manufacturers must prioritize:
- Capital-efficient local production strategies (CKD assembly, strategic partnerships)
- Premium brand development to escape margin compression
- Comprehensive charging infrastructure partnerships
- Autonomous vehicle technology to differentiate from future low-cost competitors
Incumbent manufacturers face imperatives to:
- Accelerate NEV cost reduction through dedicated platforms and manufacturing
- Consider strategic partnerships or technology licensing with Chinese firms
- Focus on segments where brand heritage provides defensibility (luxury, performance)
- Rationalize dealer networks to reduce EV distribution costs
For Suppliers and Adjacent Industries
Battery manufacturers: Capacity expansion in regional hubs (Europe, Southeast Asia, Latin America) to serve localized vehicle production while meeting content requirements.
Charging infrastructure: Massive investment requirements create opportunities for utilities, construction firms, and software platforms. Markets with high NEV growth but low current infrastructure (Latin America, Southeast Asia) offer highest returns.
Semiconductors and software: Chinese automakers' vertical integration creates demand for tier-1 suppliers in perception sensors, compute platforms, and middleware. Specialized capabilities (LiDAR, domain controllers) remain outsourced.
For Policymakers
Governments face trade-offs between industrial policy, consumer affordability, and climate objectives:
Import-dependent markets (most of Latin America, Middle East, Africa): Chinese NEVs accelerate electrification but prevent domestic industry development. Policy should focus on charging infrastructure, grid capacity, and value-chain positioning (assembly, sales/service) rather than full manufacturing.
Markets with existing automotive industries (Europe, Southeast Asia): Balanced approaches incentivizing technology transfer, local production requirements, and gradual tariff phase-ins can preserve employment while capturing electrification benefits.
Conclusion: Structural Transformation, Not Trade Cycle
Chinese automotive exports represent a fundamental industry restructuring, not a temporary phenomenon. Three factors drive durability:
- Technology leadership in growth segments: Chinese manufacturers lead NEV technology at scale, with 5-10 year advantages in battery integration, software, and cost optimization
- Aligned policy and market incentives: Energy security, climate commitments, and consumer economics all favor electrification—where Chinese brands excel
- Demonstrated localization commitment: 168+ overseas facilities (under construction or operating) indicate long-term strategic intent beyond opportunistic exports
The relevant comparison is not whether Chinese brands replicate Japanese success, but whether they exceed it. Japanese manufacturers required decades to reach 23% international market share through superior quality and efficiency in internal combustion vehicles. Chinese manufacturers target similar share within 5-7 years through leadership in electric vehicles—a faster-growing, policy-supported segment with clearer technological differentiation.
For businesses, investors, and policymakers, the strategic question isn't whether Chinese automakers will capture international market share, but how quickly, in which segments, and at whose expense. The transformation is underway; adaptability determines who benefits.
Key Takeaway: China's auto export surge reflects structural advantages in electric vehicle technology, manufacturing scale, and policy alignment—not temporary market conditions. With only 11% current share in accessible international markets versus 50%+ NEV leadership, Chinese automakers have clear runway for sustained growth. The industry restructuring favors companies (Chinese and foreign) that embrace electrification, while creating headwinds for those defending legacy technologies. Energy security concerns and accelerating climate policies amplify these trends, making Chinese NEV exports a defining feature of 2025-2030 automotive markets.
Related Coverage:
China EV Outlook: Domestic Saturation Triggers Export Pivot and Channel Wars in 2026